jittr

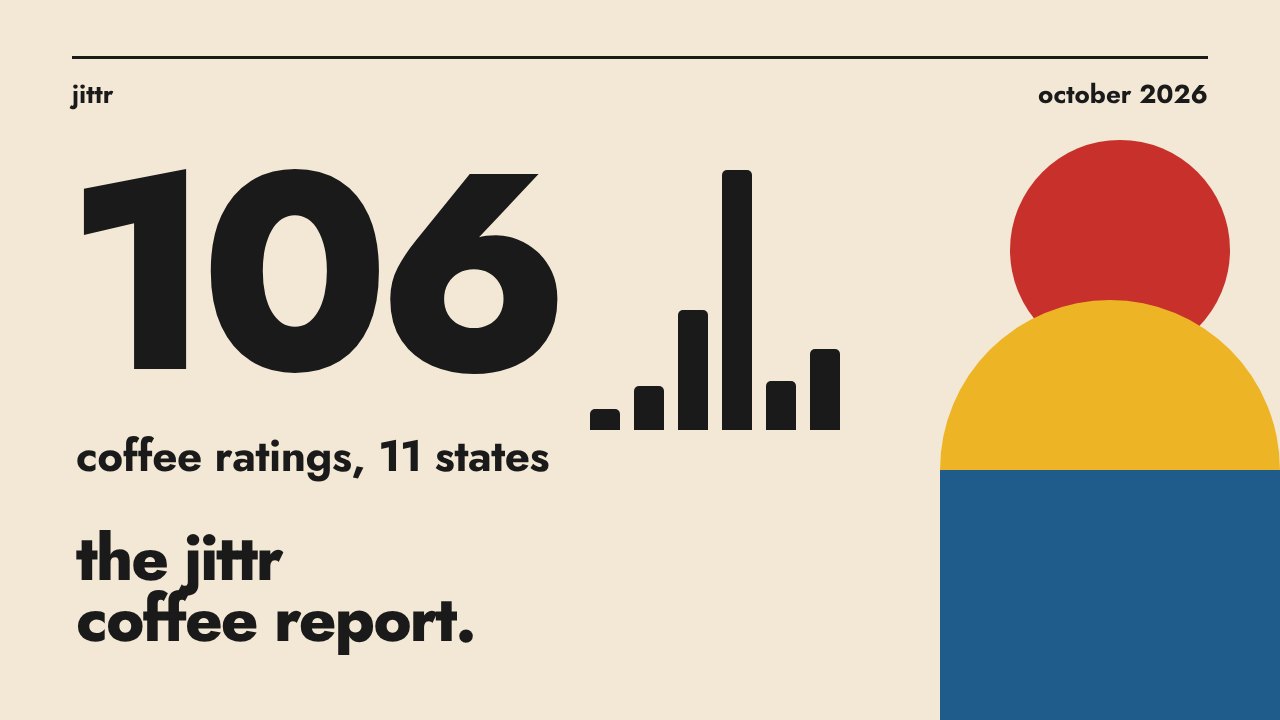
This is the first Jittr Coffee Report. It covers every rating logged in Jittr from the first check-in on May 22, 2026 through October 20, 2026: 106 ratings of cups and bags of coffee in 11 US states and one other country. No rating here is tied to a name, and any café, city or state with fewer than 5 ratings is grouped or left out.
How the scores fall
Scores run from 1 to 10. Most ratings landed on 8 (27) or 7 (26), and the average across all 106 is 7.09. Five cups earned a 10, and one rating fell below 4.
Ratings by score
All 106 ratings, 1 to 10
See the data
| Score | Ratings |
|---|---|
| 1 | 0 |
| 2 | 1 |
| 3 | 0 |
| 4 | 4 |
| 5 | 14 |
| 6 | 15 |
| 7 | 26 |
| 8 | 27 |
| 9 | 14 |
| 10 | 5 |
Ratings by month
August was the busiest month with 48 ratings, the month after Jittr launched on the App Store on July 28. Ratings before July 28 came from early testers. October's count runs through the 20th.
Ratings per month
May 22 to October 20, 2026
See the data
| Month | Ratings |
|---|---|
| May 2026 | 4 |
| Jun 2026 | 8 |
| Jul 2026 | 22 |
| Aug 2026 | 48 |
| Sep 2026 | 9 |
| Oct 2026 | 15 |
What people ordered
Lattes led with 39 of 91 cup ratings, ahead of drip coffee at 31. Lattes also scored higher, averaging 7.15 against 6.55 for drip. No other drink has reached 5 ratings yet.
Cup ratings by drink
91 cup ratings; bags of beans not included
"Tea and chai" combines green tea, black tea, chai and chai lattes. "Other" covers a cappuccino, a mocha and a seasonal lemonade.
See the data
| Drink | Ratings | Average score |
|---|---|---|
| Latte | 39 | 7.15 |
| Drip | 31 | 6.55 |
| Filter | 4 | under 5 ratings |
| Tea and chai | 4 | under 5 ratings |
| Cold brew | 3 | under 5 ratings |
| Americano | 2 | under 5 ratings |
| Not specified | 5 | 8.20 |
| Other | 3 | under 5 ratings |
Iced drinks averaged 7.75 against 7.00 for hot cups, on 8 iced ratings so far. Half of them were lattes. Decaf cups averaged 7.44, and 7 of the 9 were lattes.
Roast levels
73 ratings listed a roast level. Medium led with 47, followed by dark with 20 and light with 6. Medium roasts averaged 7.28 and dark roasts 7.00. Light roast has 6 ratings so far, too few to compare.
Ratings by roast level
73 ratings with a roast level
See the data
| Roast | Ratings | Average score |
|---|---|---|
| Light | 6 | 7.00 |
| Medium | 47 | 7.28 |
| Dark | 20 | 7.00 |
Flavor notes
62 ratings carried at least one flavor tag. Chocolate (22), nutty (21) and earthy (20) led. Among tags used at least 5 times, bright scored highest, averaging 8.25 across 8 ratings.
Most-used flavor tags
Top 10 of 48 tags, by number of ratings
See the data
| Flavor tag | Ratings | Average score |
|---|---|---|
| Chocolate | 22 | 7.36 |
| Nutty | 21 | 7.10 |
| Earthy | 20 | 7.15 |
| Caramel | 13 | 6.85 |
| Smoky | 12 | 7.25 |
| Vanilla | 10 | 7.60 |
| Bright | 8 | 8.25 |
| Citrus | 6 | 7.83 |
| Juicy | 5 | 7.80 |
| Brown Sugar | 4 | under 5 ratings |
What went into the lattes
19 lattes listed an added flavor. Cinnamon led with 6. All 4 pumpkin spice lattes were logged in October, after the chains brought their fall menus back in August.
Latte add-ins
Flavors added to 19 lattes, shown when used at least twice
See the data
| Add-in | Lattes |
|---|---|
| Cinnamon | 6 |
| Pumpkin Spice | 4 |
| Vanilla | 3 |
| Mocha | 2 |
| Cardamom | 2 |
| Caramel | 2 |
| Honey | 2 |
| Chai | 2 |
Ratings by state
Virginia has the most ratings with 38, most of them from the Richmond area. Oregon follows with 17, then Illinois with 10, Delaware with 9 and North Carolina with 8. Among those 5 states, Delaware averaged highest at 8.11 and Virginia lowest at 6.66. Six more states have between one and four ratings each: Hawaii, New Jersey, New York, Pennsylvania, Vermont and West Virginia.
Where the ratings came from
US ratings by state; states with fewer than 5 ratings show as a range
See the data
| State | Ratings |
|---|---|
| Virginia | 38 |
| Oregon | 17 |
| Illinois | 10 |
| Delaware | 9 |
| North Carolina | 8 |
| Hawaii | 1-4 |
| New Jersey | 1-4 |
| New York | 1-4 |
| Pennsylvania | 1-4 |
| Vermont | 1-4 |
| West Virginia | 1-4 |
Average score by state
States with at least 5 ratings
See the data
| State | Ratings | Average score |
|---|---|---|
| Virginia | 38 | 6.66 |
| Oregon | 17 | 7.88 |
| Illinois | 10 | 7.70 |
| Delaware | 9 | 8.11 |
| North Carolina | 8 | 7.50 |
Coffee in Richmond, Virginia
The Richmond area, counting Richmond, Henrico and Mechanicsville, has more Jittr ratings than any other metro: 38, from 17 cafés plus 8 bags of beans. Lattes led with 15 ratings and drip followed with 11. Richmond's average of 6.66 is the lowest of the 4 metros with at least 5 ratings, and its scores spread from 4 to 9. Nutty was the most-tagged flavor note, and cinnamon and pumpkin spice led the latte add-ins.
Two Richmond roasters account for 11 of the 15 bags rated in Jittr: Blanchard's Coffee with 6 ratings averaging 7.3 and Rostov's Coffee & Tea with 5 ratings averaging 7.4. The one Richmond café with at least 5 ratings is a Starbucks, which averaged 6.0.
Coffee in Bend, Oregon
All 13 Bend ratings came in August, so read them as one snapshot. They averaged 7.77, second among metros with at least 5 ratings. Lattes led with 5 ratings averaging 8.0, and 4 of the 13 drinks were tea or chai. Four were decaf. Still Vibrato Coffee Roasting is the one Bend café with at least 5 ratings, averaging 7.2 across 5.
Coffee in Chicago
Chicago's 10 ratings averaged 7.70. Lattes made up 7 of them, averaging 7.4. Every Chicago rating with a roast level was medium or light, and bright and vanilla were the most-used flavor tags with 5 each. No Chicago café has reached 5 ratings yet.
Coffee in Wilmington, Delaware
Wilmington has the highest average of any metro with at least 5 ratings, 8.29, on a small base of 7 ratings across 5 cafés. Drip was the most-rated drink with 3, and earthy was the most-used flavor tag.
October so far
Through October 20, Jittr users logged 15 ratings averaging 7.33. Drip and lattes split the month with 7 each. North Carolina contributed 8 of the 15, and Virginia 6. Pumpkin spice showed up in 4 lattes.
How this report works
- The data covers every rating logged in Jittr from May 22 through October 20, 2026, minus internal test accounts.
- No names, usernames or account IDs are used. Any café, city or state with fewer than 5 ratings is grouped or left out, and states with 1 to 4 ratings show only as a range.
- Averages here are simple means of 1 to 10 scores. Jittr's in-app rankings weight recent ratings more, so a café's rank in the app can differ from its average here.
- The next report will cover November.
Get your city into next month's report
Every cup you log in Jittr counts toward your city's numbers. A café needs 5 ratings to be named.
Download Jittr